Using the Monitors - Speeds window
The Speeds tab displays the current speeds at the transmission input, transmission output, the turbine and the vehicle in real time.
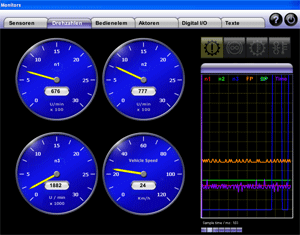
 |
How to open Monitors - Speeds: |
Select Service > Monitor 1 > Speeds in the main window. If there is communication with a connected transmission control unit, the current speeds are displayed automatically in real time.
If communication with a transmission control unit is not possible, this will be indicated by a
at the bottom right of the window:
This message is also displayed when communication with a connected transmission control unit has been interrupted.
For help in the event of communication problems, please refer to: Communication problems.
Once you have eliminated the communication problems, click "Yes" if ALADIN is to re-establish communication with a transmission control unit. An existing communication is shown by the progress bar.
|
|
The display of the speeds: |
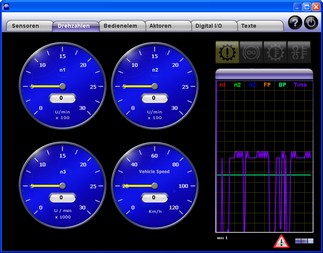
The speeds are displayed with four dial instruments.
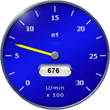
Signal Description n1 Speeds at the transmission input in rotations per minute. The speed is also displayed as a digital value. If a fault is detected at this speed sensor, "Error" will be displayed as a digital value. Perform an upload for selective troubleshooting. For further information, please see: Upload. n2 Speed at the transmission output in rotations per minute. The speed is also displayed as a digital value. If a fault is detected at this speed sensor, "Error" will be displayed as a digital value. Perform an upload for selective troubleshooting. For further information, please see: Upload. n3 Speed at the turbine in rotations per minute. The speed is also displayed as a digital value. If a fault is detected at this speed sensor, "Error" will be displayed as a digital value. Perform an upload for selective troubleshooting. For further information, please see: Upload. Vehicle Speed Vehicle speed in km/h. The speed is also displayed as a digital value in km/h. If a fault is detected at this speed sensor, "Error" will be displayed as a digital value. Perform an upload for selective troubleshooting. For further information, please see: Upload.
|
|
The general display in Monitors: |
The general display is shown in every tab.
On top, there are four symbols for:
Symbol Description General transmission fault. General retarder fault. Transmission temperature too high. Retarder temperature too high.
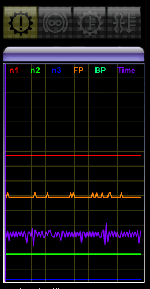
Below, there is the real-time display of the following signals:
Signal Description n1 Engine speed / transmission input speed n2 Transmission output speed n3 Turbine speed FP Accelerator pedal position BP Brake pedal position Time Display of the sample time (for debugging tasks only)


|
|
|
Further topics: |
More information on: Upload
© by Voith Turbo GmbH & Co. KG
send remarks to joachim.ehleiter@voith.com (electronic department)
or r.theilacker@voith.com (electronic department)