Display the event memory in the report
 |
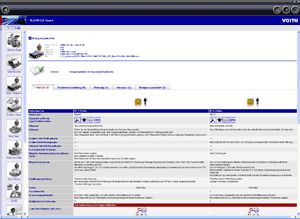
The event memory contains all events that are detected by the transmission control unit and stored in the event memory. For a better overview, the event memory has been divided into the tabs Fault, Early-warning message, Malfunction and Notes. The "Event memory" tab in the report includes a list of all events.
The event memory of a transmission control unit can store up to 10 autonomous events. For further information, please see: Operational principle and clearing the event memory. |
For further information, please see: Operational principle and clearing the event memory.
 |
In the setup, you can set a filter for the display of events. Here you can restrict the display by priorities. For further information, please see: Setup. |
 |
The current filter setting is displayed in the general content area. The example illustrates that only events of priority 1, 2 or 7 are indicated. |
| Below the filter display you can see whether the event memory has been cleared after reading. | |
 |
Event memory has been cleared. |
 |
Event memory has not been cleared. |
 |
Event memory contents in the report: |
||||||||
 |
How to evaluate the display of the event memory: |
||||||||
| The ECU report always contains events that were provided in the event memory during the last upload. The entries in the event memory are arranged chronologically from left to right. The latest entry is on the left, the oldest entry on the right. Symbols for priority and the active/passive status are arranged above each entry. For further information, please see: Active / passive events and Event priorities. | |||||||||
| Priority | active | Priority | passive | Priority | passive | ||||
 |
 |
 |
 |
... | |
|
|||
| Fault number | N° 1 / Fault | N° 2 / Early-warning system | N° 10 / Early-warning system | ||||||
| latest event | oldest event | ||||||||
| Fault code | The fault code is a hexadecimal number that contains encoded information on the fault location and fault type. This code informs the vehicle master computer whether and what type of event has occurred. For further information, please see: Fault codes. | ||||||||
| This is followed by links (redirection by clicking the symbol) to the repair manuals and expert information. | |||||
| Repair manual expert information |  |
This symbol directs you to a repair manual for the corresponding event in the ECU report. | |||
 |
This symbol directs you to further expert information on the corresponding event in the ECU report. | ||||
 |
This symbol directs you to the time information on the corresponding event in the ECU report. | ||||
 |
This symbol directs you to further properties (FMI & SPN) on the corresponding event in the ECU report. | ||||
| This is followed by information on the type of event: | |||
| Fault location | More information on: Fault location, fault type, previous fault type, action location etc. | ||
| Fault type | |||
| Fault type additional information | |||
| Event setting conditions | |||
| Event test conditions | |||
| Previous fault type | |||
| System response | The system response describes how the vehicle or transmission responds to this event, e.g.: "Hard shifts may occur." | ||
| Possible causes | The possible causes describe why this event occurred, e.g.: Speed sensor N2 faulty. | ||
| Instruction | The instruction describes briefly how the fault / event can be eliminated, e.g.: Install/repair terminating resistors of the CAN bus. | ||
| Status | The status indicates whether an event is active or passive. For further information, please see: Active / passive events. | ||
| Priority level | Priority of the event. For further information, please see: Event priorities. | ||
| Priority description | The description of the priority provides information on how an event influences the vehicle's safety and how urgent the repair / maintenance must be carried out. | ||
| Frequency of occurrence | The frequency of occurrence indicates how often this event has become active since the event memory was cleared last. | ||
| Information on the time flags of the events follow: | |||
| Time flags at first occurrence: | |||
| ..between event and reading | This is information on the time when the event became active for the first time. | ||
| ..after system start | |||
| ..Date | For further information, please see: Time stamps in event memory entries. | ||
| ..Time | |||
| ..Mileage | |||
| Time flags at last disappearance: | |||
| ..between event and reading | This is information on the time when the event became active for the last time. | ||
| ..after system start | |||
| ..Date | For further information, please see: Time stamps in event memory entries. | ||
| ..Time | |||
| ..Mileage | |||
| This is followed by information on the ambient conditions when the event occurred for the first time: | |||
| Ambient conditions | |||
| Operating status | Specification whether the transmission is in drive program or in neutral, e.g.: drive program | ||
| Status of the shift manager | Specification in what gear the transmission is, e.g.: 1st gear | ||
| Condition of the brake manager | Specification whether a brake request is provided, e.g.: idle (no brake request) | ||
| Vehicle speed | e.g., 28 km/h | ||
| Engine speed | e.g., 728 rpm | ||
| Oil temperature (sump) | 80°C | ||
| Oil temperature (retarder) | 79°C | ||
| Oil level | |||
| Accelerator pedal position | Accelerator pedal position in per cent (100% = full speed), e.g.: 54% | ||
| Brake pedal position | Brake pedal position in per cent (100% = full braking), e.g.: 0% | ||
| Engine torque | |||
| Retarder actual torque | e.g., 0 Nm | ||
|
|
How to adjust the report contents: |
In the ALADIN Setup, you can configure what is displayed and how it is displayed in the ECU report. Click Setup > Report in the main window. For further information, please see: Report setup.
|
|
FAQ: |
Why do some events have no time stamps?
Dates and absolute time indications are signalled to the transmission control unit via the CAN bus. If the vehicle does not send this information on the CAN bus, this data cannot be entered in the event memory. For further information, please see: Time stamps in event memory entries.
Why do some events have no kilometer stamps?
The current mileage is signalled to the transmission control unit via the CAN bus. If the vehicle does not send this information on the CAN bus, this data cannot be entered in the event memory.
After how much time are faults deleted automatically from the event memory?
This time is set in the dataset of the vehicle. The default value is 200 hours. For further information, please see: Operational principle and clearing the event memory.
|
|
Further topics: |
More information on: Upload
More information on: Setup
More information on: Priorities
More information on: Active / passive events
More information on: Fault locations and fault types
More information on: Time stamps in event memory entries
More information on: Operational principle and clearing the event memory
More information on: DIWA.5 possible solenoid valve states
More information on: FAQ
Up
>
© by Voith Turbo GmbH & Co. KG
send remarks to joachim.ehleiter@voith.com (electronic department)
or r.theilacker@voith.com (electronic department)